Energy Return on Investment for European Renewables
- 2 hours ago
- 8 min read

TL;DR:
Energy return on investment (EROI) measures the energy produced relative to the energy used for creation. It determines if renewable projects generate genuine energy value or act as energy sinks, influencing investment decisions. Higher EROI values indicate more efficient and profitable energy systems, especially important in European renewable markets.
Energy return on investment (EROI) is defined as the ratio of usable energy delivered by a system to the energy required to produce it. For European business owners and investors evaluating solar PV, battery storage, or wind projects, EROI is the foundational metric that determines whether a project creates real energy value or simply consumes it. A project with an EROI below 1:1 is an energy sink by definition. Understanding where your project sits on that scale, and how it interacts with financial returns and European policy incentives, is what separates a sound investment from a costly mistake.
How is energy return on investment calculated and interpreted?
EROI is calculated with a straightforward formula: energy delivered divided by energy invested. If a solar PV system produces 10 units of energy over its lifetime and required 2 units to manufacture, install, and maintain, the EROI is 5. That number tells you the system returns five times the energy it consumed to exist.
The break-even point is an EROI of 1. Below that, the system destroys more energy than it creates. The practical viability threshold is higher. EROI above 3:1 is the minimum for a source to be considered viable, while an EROI above 5 is considered highly profitable from an energy standpoint. Values between 1 and 5 represent moderate returns that may still be financially attractive depending on incentive structures.
Where EROI calculations get complicated is in defining what counts as “energy invested.” A narrow boundary includes only direct fuel and electricity used in manufacturing. An expanded boundary adds transportation, installation labor, grid infrastructure, and end-of-life decommissioning. For storage technologies, analysts use a variant called ESOIe (Energy Stored on Invested Energy), which accounts for the round-trip efficiency losses inherent in battery systems.
Key factors that affect EROI measurement accuracy:
Boundary definition: Narrow versus expanded system boundaries can shift EROI values significantly for the same technology.
Capacity factor: A solar array in southern Spain operates at a higher capacity factor than one in Belgium, producing more energy from the same investment.
Technology vintage: A 2026 bifacial solar panel has a materially different EROI than a 2010 panel, even at the same rated capacity.
Storage integration: Adding battery storage reduces net EROI because energy is lost in charge and discharge cycles.
Pro Tip: When comparing EROI figures from different studies, check the system boundary first. Comparing a narrow-boundary EROI for wind against an expanded-boundary EROI for solar will produce a misleading result every time.
How do EROI values differ across major energy sources?
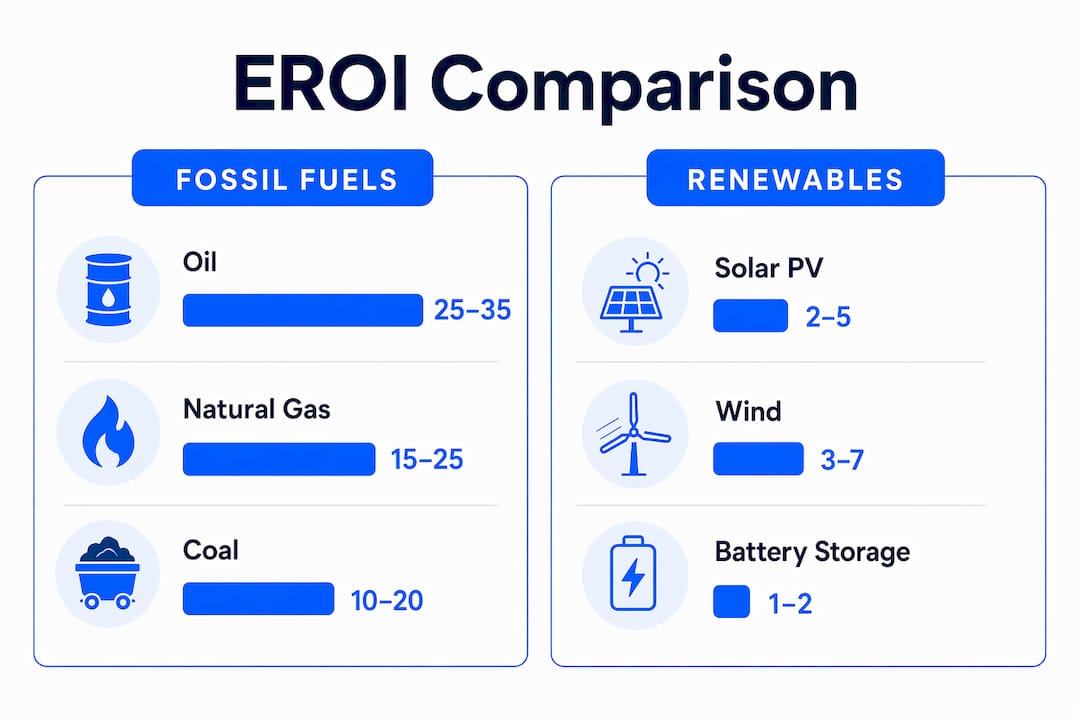
EROI values vary widely across energy sources, and the gap between fossil fuels and renewables is narrowing faster than most investors expect. Oil fields that once delivered EROI ratios of 30:1 or higher now average 4–30 depending on field maturity and extraction method. Natural gas typically sits at the higher end of that range. Coal delivers moderate EROI but carries regulatory risk in European markets under the EU Green Deal.

Renewables tell a different story. Solar PV and wind EROI values have improved steadily as manufacturing processes matured and panel efficiencies increased. The trajectory matters as much as the current number.
Energy source | Typical EROI range | Trend |
Conventional oil | 4–30 | Declining |
Natural gas | 10–20 | Stable to declining |
Coal | 30–80 (gross), declining net | Declining |
Onshore wind | 18–34 | Improving |
Solar PV (utility scale) | 8–14 | Improving |
Lithium-ion battery storage | 2–10 (ESOIe) | Improving |
The practical implication for European investors is clear. Fossil fuel EROI is declining as easy reserves are depleted. Renewable EROI is rising as technology matures. A commercial solar project commissioned in 2026 starts with a better energy efficiency profile than one built in 2015, even before accounting for lower capital costs.
EROI also connects directly to Levelized Cost of Energy (LCOE). Higher EROI generally correlates with lower LCOE because more energy output is produced per unit of input cost. For European commercial projects, solar LCOE ranges of €0.04–€0.08 per kWh are now common at utility scale, sitting well below typical grid rates across Germany, the Netherlands, and Belgium.
Pro Tip: Do not evaluate storage EROI in isolation. A battery system with an ESOIe of 5 paired with a solar array at EROI 12 creates a blended system EROI that is still well above the viability threshold. Evaluate the integrated system, not individual components.
What financial metrics complement EROI for energy investment analysis?
EROI and financial ROI measure fundamentally different things. EROI measures biophysical efficiency. Financial ROI measures monetary return. A project can have a strong EROI and a weak financial ROI if electricity prices are low or incentives are absent. The reverse is also possible. Relying on only one metric risks stranded assets.
The financial metrics that matter most for European renewable projects are:
Internal Rate of Return (IRR): The annualized return on invested capital. A typical 100 kW commercial solar system achieves an IRR of 12–22% over 25 years, depending on location and incentive access.
Payback period: The time to recover capital from energy savings. Commercial solar projects commonly achieve payback in 5–8 years in Western Europe.
Net Present Value (NPV): The total value of future cash flows discounted to today. A positive NPV confirms the project creates value above the cost of capital.
LCOE: The all-in cost per kWh produced over the system’s lifetime. Lower LCOE means the project competes more effectively against grid electricity prices.
European-specific incentives shift these numbers materially. VAT reductions on solar equipment, accelerated depreciation schemes in Belgium and the Netherlands, and feed-in premium contracts in Germany all reduce effective capital cost and shorten payback periods. Stacking these incentives is not optional. It is the difference between a 7-year payback and a 5-year payback on the same hardware.
Sensitivity analysis is non-negotiable for any project above €500,000. Capital expenditure overruns affect Debt Service Coverage Ratio (DSCR) more severely than tariff fluctuations do. A project that looks viable at base-case assumptions may fail its debt covenants under a 15% CAPEX overrun scenario. Probabilistic modeling, including Monte Carlo simulation, surfaces these risks before they become problems.
How can European investors apply EROI insights to optimize projects?
Applying EROI and financial metrics together requires a structured approach. The following steps reflect how experienced European energy investors move from analysis to decision.
Establish the EROI baseline. Before modeling financial returns, confirm the technology’s EROI using expanded system boundaries. This tells you whether the project creates genuine energy value independent of price signals.
Layer incentives deliberately. Stacking tax benefits, utility rebates, and grid service revenues produces returns that no single incentive achieves alone. In Central Europe, combining investment tax credits with grid balancing contracts can reduce effective payback by 2–3 years. Review the available solar incentives in Central Europe before finalizing your financial model.
Model demand savings separately. Most investors calculate kWh savings and stop there. Demand savings from peak load reduction account for 20–40% of total utility bill reductions in commercial projects. Ignoring demand charges leads to systematic payback overestimation.
Run scenario and sensitivity analysis. Use at least three scenarios: base case, CAPEX overrun, and low-tariff environment. Probabilistic sensitivity modeling identifies which variables most affect your IRR and NPV, allowing you to hedge or renegotiate contract terms accordingly.
Align project choice with both high EROI and favorable financial ROI. A project with EROI of 12 and IRR of 18% is a strong candidate. A project with EROI of 4 and IRR of 22% carries hidden long-term risk if energy prices shift or regulations tighten. Both metrics must clear their respective thresholds.
Account for European policy volatility. The EU’s Renewable Energy Directive and national grid codes are evolving. Projects that qualify for current incentives may face revised terms at contract renewal. Build policy risk into your discount rate, not just your scenario analysis.
Pro Tip: Use a 25-year financial model that includes degradation curves, inflation-adjusted energy prices, and policy renewal assumptions. A model that only runs to payback misses the majority of the project’s value creation.
Key takeaways
Effective energy investment analysis requires both EROI and financial metrics working together, not as substitutes for each other.
Point | Details |
EROI viability threshold | An EROI above 3:1 is the minimum for a viable energy source; above 5 is considered highly profitable. |
Renewable EROI is rising | Solar PV and wind EROI values are improving as technology matures, making them stronger long-term investments. |
Financial metrics must complement EROI | IRR, NPV, payback period, and LCOE each reveal dimensions that EROI alone cannot capture. |
Demand savings are underestimated | Peak load reduction accounts for 20–40% of utility bill savings and must be included in payback calculations. |
Incentive stacking accelerates returns | Layering tax credits, depreciation, and grid service revenues can cut payback periods by 2–3 years in European markets. |
Why I think most investors are looking at only half the picture
After working through dozens of commercial energy project evaluations across Europe, the pattern I see most often is investors who treat EROI as an academic footnote and financial ROI as the only number that matters. That approach works until it doesn’t.
EROI is the master driver of long-term economic productivity. When a society or a business transitions to lower-EROI energy sources, the drag on productivity is real, even if it doesn’t show up in a quarterly earnings report. Investors who ignored this dynamic during the shale boom in the United States learned it the hard way when stranded assets piled up.
The European context adds another layer. Policy incentives are generous right now, but they are not permanent. A project that only clears its financial hurdle rate because of a feed-in premium that expires in year 10 is not a sound 25-year investment. EROI gives you the floor. It tells you whether the project creates real value when the subsidies are gone.
My recommendation is to treat EROI as a filter and financial metrics as a ranking tool. If a project doesn’t clear an EROI of 5, scrutinize it hard before committing capital. If it does, then use IRR, NPV, and sensitivity analysis to rank it against alternatives. That sequence protects you from projects that look profitable on paper but are fundamentally fragile.
The investors I’ve seen succeed consistently are the ones who build scenario models before they build business cases. They know their CAPEX overrun tolerance. They know what happens to their IRR if the grid tariff drops 20%. They’ve stress-tested the incentive stack. That level of preparation is not excessive caution. It is the standard for durable returns in European energy markets.
— Marc
How Belinus helps you evaluate and optimize energy investments
Belinus works with European businesses and investors to assess the full picture of renewable energy project returns, from EROI analysis through to 25-year financial modeling. The Belinus platform integrates solar PV, battery storage, and EV charging through a centralized Energy Management System that optimizes for both energy efficiency and financial performance in real time.
Belinus’s automated quotation software, launching in January 2026, delivers 25-year financial models that include degradation curves, tariff sensitivity, and incentive stacking scenarios. For commercial and utility-scale projects, the Belinus team provides custom system design from small commercial installations to MW-scale deployments. If you are evaluating a renewable energy project in Europe and want a clear view of both your energy return metrics and financial ROI, explore Belinus solutions to get started with a project assessment.
FAQ
What is a good EROI for a renewable energy project?
An EROI above 5 is considered highly profitable from an energy standpoint. An EROI between 3 and 5 represents moderate viability, and anything below 3 warrants careful scrutiny before committing capital.
How does EROI differ from financial ROI?
EROI measures biophysical efficiency, specifically how much energy a system produces relative to the energy consumed to build and run it. Financial ROI measures monetary returns and is directly affected by electricity prices, incentives, and financing costs.
Why do demand savings matter for energy investment analysis?
Demand savings from peak load reduction account for 20–40% of total utility bill reductions in commercial projects. Excluding them from your energy savings calculation leads to a longer estimated payback period than the project will actually deliver.
How should European investors handle policy risk in their models?
Build policy risk into your discount rate and run at least three scenarios: base case, incentive reduction, and full incentive expiry. Probabilistic sensitivity modeling identifies which policy variables most affect your project’s IRR and NPV.
What is ESOIe and when does it apply?
ESOIe stands for Energy Stored on Invested Energy and is the EROI variant used for battery storage systems. It accounts for round-trip efficiency losses and gives a more accurate picture of storage viability than standard EROI calculations.
Recommended
Comments