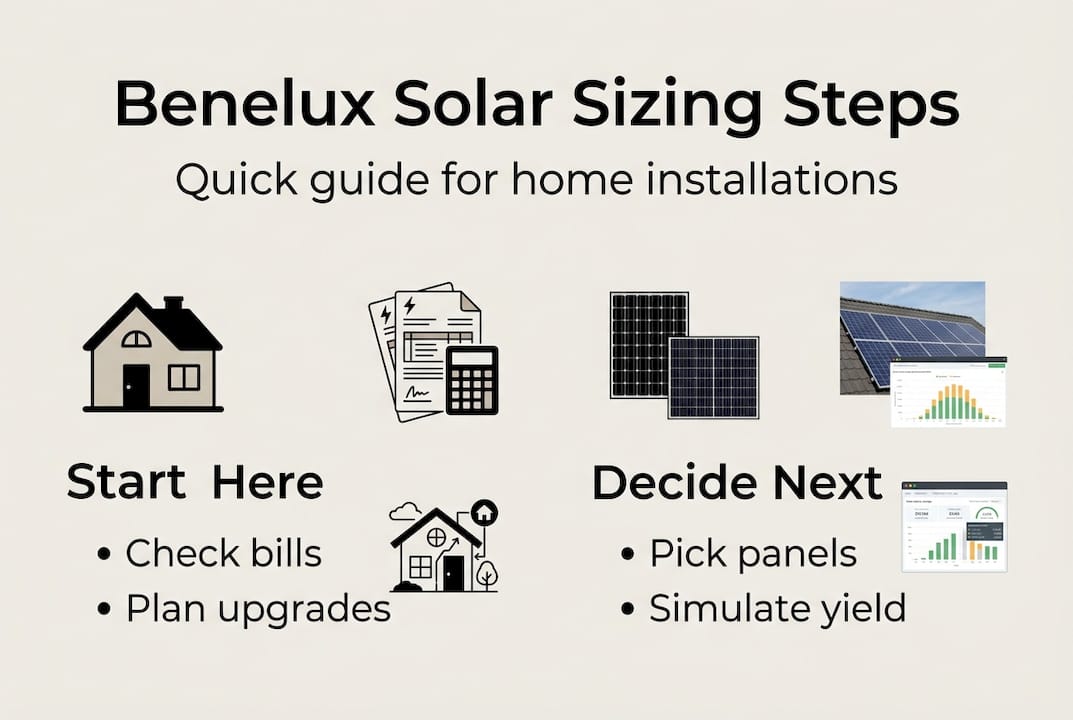
How to size a solar system for your Benelux home
- 1 hour ago
- 9 min read

TL;DR:
Proper solar sizing maximizes self-consumption and avoids costly export penalties in Benelux regions.
Use region-specific tools like PVGIS and consider future household loads for accurate system design.
Oversizing by 20-30% and monitoring production help optimize long-term solar performance.
Sizing a solar system wrong is one of the most expensive mistakes Benelux homeowners make. Go too small and you leave money on the table. Go too large and you pay export penalties that eat into your returns, especially in Flanders. The good news is that with the right data, the right tools, and a clear process, you can size your system to match your actual needs, maximize self-consumption, and build in room for future growth. This guide walks you through every step, from reading your energy bills to running simulations and avoiding the edge cases that catch most homeowners off guard.
Table of Contents
Key Takeaways
Point | Details |
Assess energy needs | Start with precise energy usage and plan for future upgrades such as electric vehicles or heat pumps. |
Use PVGIS for accuracy | Employ location-specific simulation tools like PVGIS to forecast production based on your home’s exact conditions. |
Adapt for real losses | Factor in local climate, shading, and soiling losses; size your system with 15-20% extra capacity. |
Verify and optimize | Regular monitoring and troubleshooting are essential for maximizing self-consumption and long-term savings. |
Assessing your energy needs and prerequisites
Before you touch a calculator, you need a clear picture of how much energy your household actually uses. Pull your last 12 months of electricity bills and note the monthly kWh figures. Add them up for your annual total. Most Belgian and Dutch homes consume between 3,500 and 5,500 kWh per year, but your number is the only one that matters here. A solar power checklist can help you organize this data before you start any calculations.
Now think ahead. Are you planning to buy an EV in the next two to three years? Considering a heat pump to replace your gas boiler? These additions can double your electricity demand overnight. The Benelux PV market is growing fast precisely because homeowners are electrifying everything at once. Factor those future loads into your sizing from day one, or you will be back on the roof sooner than you planned.
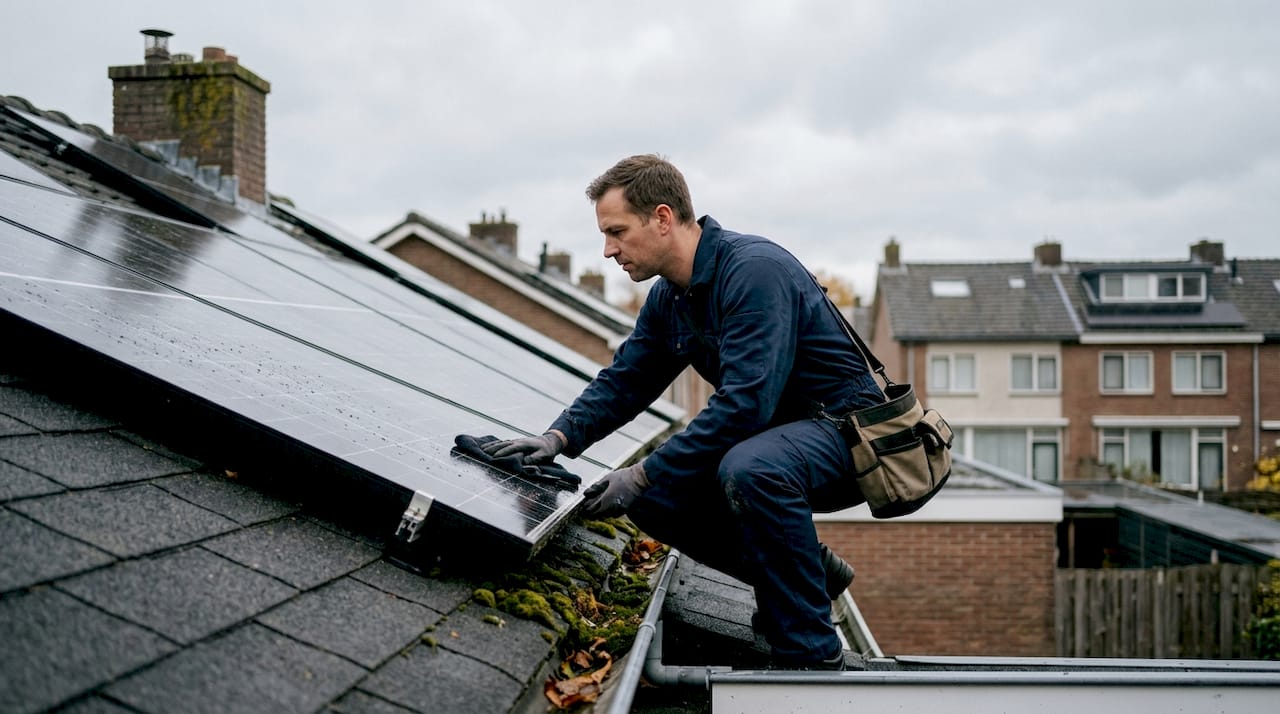
Next, assess your roof. South-facing roofs at a 30 to 35 degree tilt produce the most energy in the Benelux region. East/west splits are workable and actually spread production more evenly across the day, which can help self-consumption. Shading from chimneys, dormers, or neighboring trees is a serious issue. Even partial shading on one panel can drag down an entire string.
Here is a quick overview of the key prerequisites you need to confirm before sizing:
Annual kWh consumption from bills or smart meter
Future loads such as EV charging, heat pump, or induction cooking
Usable roof area after excluding vents, skylights, and shaded zones
Roof orientation and tilt (south-facing is optimal, minimum shading required)
Panel efficiency type you plan to use (monocrystalline outperforms polycrystalline in low-light Benelux conditions)
Local grid connection capacity and any export limits from your network operator
Panel type matters more than many guides admit. Monocrystalline panels perform better in diffuse light, which is exactly what you get on cloudy Belgian and Dutch days. Polycrystalline panels cost less but produce noticeably less in overcast conditions. For Benelux, monocrystalline is almost always the smarter choice.
Panel type | Efficiency range | Performance in low light | Typical cost |
Monocrystalline | 19-23% | Excellent | Higher |
Polycrystalline | 15-18% | Moderate | Lower |
Bifacial mono | 20-24% | Excellent | Premium |
Pro Tip: Add 20 to 30% extra capacity to your baseline calculation to account for future electrification. It costs far less to oversize slightly now than to add panels later when scaffolding and labor costs apply again. You can also explore home energy cost savings strategies to understand how system size connects to long-term financial returns.
Choosing the right tools and calculators
With your prerequisites confirmed, you can move to simulation. The gold standard for Benelux homeowners is the PVGIS simulation tool developed by the European Commission’s Joint Research Centre. It uses satellite-derived irradiance data specific to your location, accounts for local cloud cover patterns, and lets you input your exact roof specs. No generic online calculator comes close to its accuracy for Belgian, Dutch, or Luxembourg addresses.
Here is how to run a useful PVGIS simulation in five steps:
Enter your location by typing your address or dropping a pin on the map.
Set your system parameters including installed peak power (kWp), panel technology, and mounting type.
Input roof tilt and azimuth (azimuth 0 = south, negative = east, positive = west).
Set system losses to 14% as a starting point, then adjust for your specific shading and cable length.
Review the monthly output table and export the hourly data file for deeper analysis.
The hourly export is where most homeowners stop short. That CSV file lets you overlay your consumption profile against predicted production hour by hour. This reveals exactly when you are self-consuming versus exporting, which is critical for optimizing sizing in regions with export penalties.
Other tools worth knowing:
Tool | Best for | Limitation |
PVGIS | Accurate Benelux yield simulation | Requires manual input |
SolarEdge Designer | String and optimizer layout | Brand-specific |
PVsyst | Professional-grade modeling | Steep learning curve |
Enphase Installer Tool | Microinverter systems | Brand-specific |
PVGIS accounts for Benelux-specific irradiance, spectral effects, and wind cooling on panels, making it the most reliable free tool available for this region. Understanding the solar system components before running simulations helps you input accurate parameters and interpret the results correctly.
Sizing calculations and adapting for local conditions
Once you have your PVGIS output, the math becomes straightforward. Divide your annual consumption by the specific yield PVGIS gives you (expressed in kWh per kWp per year for your location). That gives you the system size in kWp needed to cover 100% of your consumption on paper.
Here is a worked example:
Annual consumption: 4,500 kWh
PVGIS specific yield for your location: 900 kWh/kWp (typical for Belgium)
Baseline system size: 4,500 divided by 900 = 5 kWp
Apply real-world loss factor of 15 to 20%: 5 kWp divided by 0.82 = approximately 6.1 kWp
Round up to nearest standard size: 6.5 kWp
Select inverter: Target a DC/AC ratio between 1.1 and 1.5, so a 5 kW inverter works well here.
Real-world losses are where sizing goes wrong for most people. Shading, soiling, temperature derating, cable resistance, and inverter inefficiency all chip away at your output. According to inverter sizing discussions from Belgian installers, partial shading alone can reduce output by 20 to 50% if string design is not handled carefully.
“Hot temperatures can significantly derate panel efficiency in the Benelux region. Factor in at least 15% extra capacity for peak summer days to maintain expected output.”
Flandersspecific note: the prosumertarief penalizes homeowners who export large amounts of power to the grid. Oversizing your system in Flanders without battery storage is a real financial risk. Sizing for self-consumption rather than maximum production is the smarter play there. An east/west split orientation actually helps here because it spreads production across more hours, increasing the chance that generated power is used immediately.
Pro Tip: A DC/AC ratio between 1.1 and 1.5 means your panel array is slightly larger than your inverter’s rated output. This is intentional. It boosts morning and afternoon production without overloading the inverter at peak midday sun. You can verify the financial impact of different sizing scenarios with a solar ROI calculation before committing to a design. For a full payback timeline, the solar payback guide covers Benelux-specific scenarios in detail.
Verification, troubleshooting and optimizing your solar system
Sizing does not end at installation. The first three months of real production data are your most valuable feedback tool. Compare your actual monthly kWh output against the PVGIS prediction for the same months. A gap of more than 15% signals a problem worth investigating.
The most common sizing and installation errors Benelux homeowners encounter:
Overestimating usable roof area: Only 25 to 40% of roof area is typically usable once vents, skylights, and setback requirements are excluded.
Ignoring seasonal shading: A tree that casts no shadow in winter can block significant production from April through September.
Mismatched inverter size: An inverter that is too small clips peak production; one that is too large runs inefficiently at partial load.
Overlooking cable losses: Long cable runs between panels and inverter add resistance and reduce output.
Skipping monitoring setup: Without real-time data, problems go undetected for months.
For self-consumption optimization, the goal is to shift as much flexible load as possible into peak production hours. Run your dishwasher, washing machine, and EV charger between 10 AM and 3 PM on sunny days. A smart energy management system automates this without you needing to think about it. Explore solar, storage and EV tips for practical strategies that work with your existing appliances.
Battery storage is the other lever. Adding a battery lets you capture midday surplus and use it in the evening, pushing self-consumption rates from around 30% to 70% or higher depending on your usage pattern. For a detailed approach to maximizing what you use from your own panels, the solar consumption optimization guide is worth reading before finalizing your design.
Pro Tip: Set a calendar reminder to review your monitoring data every three months for the first year and annually after that. Production that drops more than 10% year over year without a weather explanation usually points to a soiling issue, a failing panel, or a loose connection.
Expert perspective: What most guides miss about solar sizing in Benelux
Most sizing guides treat solar as a static math problem. Pick your consumption, divide by yield, add panels. Done. But Benelux solar is anything but static, and that framing leads homeowners to make decisions that look good on paper and underperform in practice.
The biggest blind spot is dynamic household load growth. A family that installs a heat pump and two EVs within three years of their solar install will find their carefully sized 6 kWp system suddenly covering only half their needs. Sizing for today’s consumption is sizing to fall short.
The second blind spot is PVGIS’s hourly data. Almost nobody uses it. But that file tells you exactly which hours of the day your system produces more than you consume, and by how much. That is the data you need to decide whether a battery makes sense, whether east/west orientation beats south-facing for your specific usage pattern, and whether you are at real risk from Flanders export penalties.
Finally, community solar setups are an underused option for homes with limited roof space. Sharing a larger installation with neighbors can unlock better economics than a compromised rooftop system. Local regulations are evolving fast on this front, and it is worth understanding your options before assuming a rooftop install is your only path.
How Belinus supports smarter solar sizing
Getting solar sizing right in the Benelux region takes more than a generic online calculator. It takes region-specific knowledge, honest assessment of your roof and loads, and tools that reflect how the local grid and regulations actually work.

At Belinus, we have built our guides, calculators, and consultation resources specifically for Benelux homeowners. Whether you are comparing panel types, modeling a system with battery storage, or trying to understand how the prosumertarief affects your sizing decision, our team and tools are set up to give you accurate, actionable answers. Explore our resources to plan a system that performs as well in year ten as it does on day one.
Frequently asked questions
How can I estimate my household’s annual energy needs before sizing a solar system?
Check your energy bills or smart meter for monthly kWh figures, then add them up for your annual total. A consumption baseline from 12 months of bills gives you the most accurate starting point.
What’s the most accurate tool for simulating solar production in Benelux?
The EU PVGIS tool gives highly accurate, Benelux-specific results by accounting for roof tilt, local irradiance, and climate. It is the most reliable free simulation option available for Belgian, Dutch, and Luxembourg addresses.
How much roof space do I need for a typical residential solar system?
Usually 25 to 40% of roof area is usable for panels once vents, skylights, and setback zones are excluded. Actual system size depends on your consumption and the panel efficiency you choose.
Should I size for maximum panel coverage or optimal self-consumption?
Aim for optimal self-consumption, especially in Flanders where the prosumertarief penalizes large grid exports. Panels beyond your realistic self-use capacity add cost without proportional financial return.
How can I future-proof my solar system sizing?
Build in 20 to 30% extra capacity beyond your current consumption and account for future loads like EV charging and heat pumps. Review system performance annually to catch any production gaps early.
Recommended
Comments