Energy Consumption Monitoring: Cut Costs in 2026
- Jul 8
- 7 min read
TL;DR:
Monitoring energy consumption helps identify waste and reduces bills for homes and businesses.
Using smart meters, sub-metering, and software analysis enables ongoing data-driven energy management.
Energy consumption monitoring is the process of tracking and analyzing how much electricity, gas, or heat a building uses, in real time or at regular intervals, to uncover waste and reduce costs. Without it, utility bills run 15–30% higher than they need to. Structured energy management systems help SMEs cut an average of 15% over three years. Standards like ISO 50001 give facility teams a framework to move from reacting to bills to actively managing consumption. Whether you own a home or run a business, the first step is always the same: measure before you act.
What are the essential components of energy consumption monitoring?
Effective power consumption monitoring starts with the right hardware. Three categories cover most use cases: smart meters at the building level, plug-level monitors for individual appliances, and whole-building sub-metering systems that break consumption down by circuit or department.
Smart meters are the foundation for most homeowners and small businesses. Residential smart meter hardware costs €200–220 per unit. That price point is manageable for most households, though regulatory complexity in some markets slows adoption. The EU targets 65% smart meter coverage across member states by 2033, yet Germany sits at just 5% as of 2026, with annual installation targets of 500,000 units.
Plug-level monitors add granularity. They identify which appliances draw the most power and flag devices that consume electricity even when switched off, a pattern called standby load. Whole-building systems go further, using current transformers clamped to circuit breakers to monitor every branch of an electrical panel without rewiring.
Software ties the hardware together. A good energy usage tracking platform collects data, visualizes patterns, and sends alerts when consumption spikes. 15-minute data intervals reveal daily patterns like standby load or appliance peaks that monthly bills completely hide. Belinus integrates this capability directly into its centralized Energy Management System, which runs on 15-minute dynamic tariff optimization and connects to a native mobile app and web dashboard.
Tool category | Best for | Key feature |
Smart meter | Whole-building baseline | Real-time grid data, dynamic tariff access |
Plug-level monitor | Appliance-level tracking | Identifies standby losses per device |
Sub-metering system | Multi-zone or commercial | Circuit-level breakdown, load peak detection |
EMS software platform | Data analysis and control | Automated alerts, pattern recognition, tariff optimization |
Pro Tip: Start with a smart meter and one month of baseline data before buying additional hardware. You will quickly see which circuits or appliances justify deeper monitoring.
How to implement energy monitoring step by step
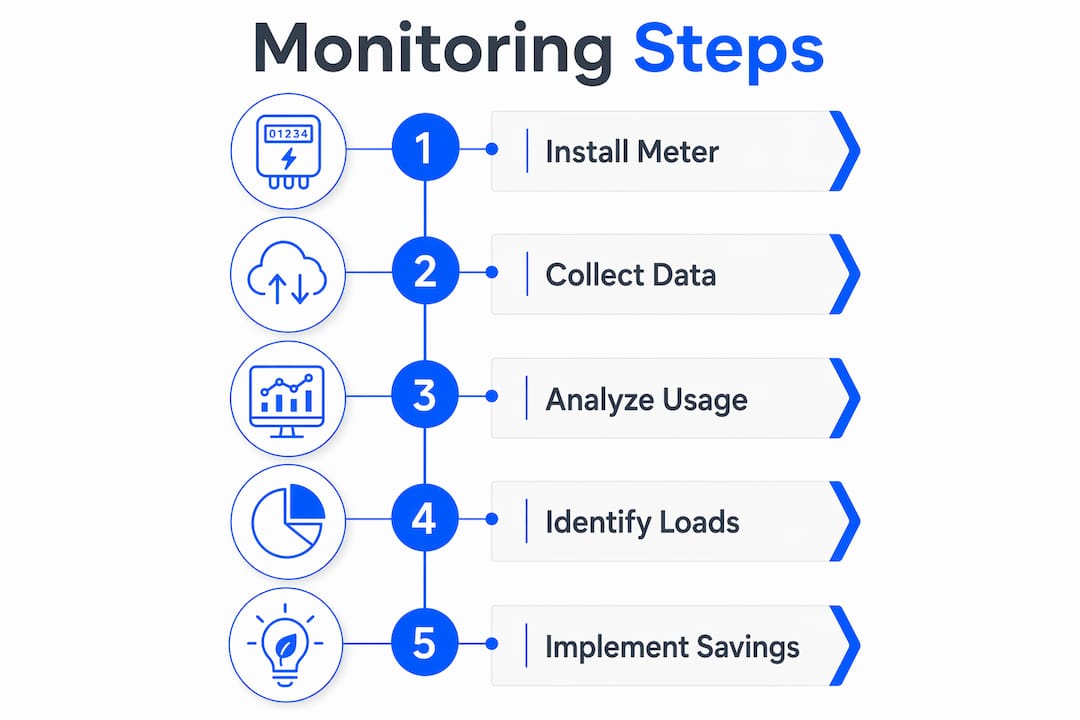
A working monitoring setup follows a clear sequence. Skipping steps, especially the goal-setting phase, produces data without direction.
Define your goals. Decide whether you are targeting a specific cost reduction, a carbon footprint cut, or compliance with a standard like ISO 50001. A measurable target, such as reducing peak load by 20%, keeps the project focused.
Establish a baseline. Run your smart meter for at least four weeks before making any changes. Record total consumption, peak demand times, and the cost per kilowatt-hour under your current tariff.
Install sub-meters on major energy users. HVAC systems, industrial machinery, EV chargers, and water heaters typically account for the largest share of a building’s load. Monitoring 20% of assets that represent 80% of energy use gives the best balance of insight and effort.
Connect hardware to your analytics platform. Confirm that data flows correctly and that timestamps align across devices. Gaps or mismatched timestamps corrupt your consumption analysis.
Analyze patterns weekly for the first three months. Look for load peaks during off-peak hours, appliances that never fully power down, and consumption spikes that do not match operational schedules.
Implement targeted changes. Shift flexible loads, such as dishwashers, EV charging, or battery storage charging, to off-peak windows. Schedule HVAC setbacks during unoccupied hours.
Review and repeat. Compare post-change data to your baseline. Quantify savings. Adjust your monitoring focus as you resolve each inefficiency.
Pro Tip: For businesses, assign one person to own the weekly data review. Monitoring data that nobody reads produces zero savings.
The ISO 50001 energy management process formalizes this cycle. It shifts facility teams from reactive billing to proactive efficiency, identifying key energy consumers and setting measurable improvement targets quarter by quarter.

What are common challenges when monitoring energy consumption?
The biggest trap in energy consumption analysis is collecting too much data without a plan to use it. Granular data without strategy creates a “data swamp,” where teams spend hours reviewing dashboards but cannot identify which findings to act on. The fix is simple: monitor key meters first, define three to five KPIs, and ignore everything else until those KPIs show consistent improvement.
Regulatory complexity is a real barrier, especially for SMEs. Privacy rules around employee energy data, building permits for meter installation, and utility company requirements for grid-connected devices all add friction. Working with an installer who knows local regulations saves weeks of back-and-forth.
Data reliability is a quieter problem. Sensors drift, communication modules lose signal, and software updates can reset logging configurations. A monthly data audit, comparing meter readings to utility invoices, catches errors before they distort your consumption analysis.
“Professional monitoring systems pay for themselves in 12–18 months for mid-sized enterprises. The payback period is short enough that delaying the investment costs more than the hardware itself.”
Cost versus benefit deserves an honest look before you buy. Monitoring systems amortize in 12–18 months for mid-sized enterprises. For homeowners, the math depends on current energy prices and how much waste the baseline reveals. In high-tariff markets, the payback is faster.
How does monitoring connect to dynamic energy pricing?
Dynamic energy pricing is where real-time energy monitoring pays its biggest dividend. Static tariffs charge the same rate all day. Dynamic tariffs charge less during low-demand periods, typically overnight or midday when solar generation peaks, and more during evening peaks. You cannot take advantage of that difference unless you know exactly when and how much you consume.
Digital metering infrastructure enables households and businesses to access dynamic tariffs and automate load management for cost savings. Smart meters transmit consumption data to the grid operator in real time, which is the technical prerequisite for time-of-use pricing. Without that data link, your utility cannot offer you a variable rate.
Sweden demonstrates what full adoption looks like. Dynamic tariffs in Sweden deliver savings of up to 40% for households that actively shift loads. That figure assumes a smart meter, a monitoring platform, and at least some automated load control, such as a programmable EV charger or a battery system that charges during cheap hours.
Smart meters integrate appliances like heat pumps, EV chargers, and solar installations into the grid, enabling flexible consumption. Belinus builds this integration into its EMS, which runs battery arbitrage and automated load shifting based on live tariff signals. Residential users with smart home tech benefit most when electric heating or EV charging can be scheduled automatically.
Tariff type | Rate structure | Monitoring requirement | Savings potential |
Static flat rate | Fixed price per kWh | None | Baseline only |
Time-of-use | Two or three price bands | Smart meter | Moderate |
Dynamic / spot-linked | Hourly market price | Smart meter + real-time EMS | Up to 40% |
Key Takeaways
Effective energy consumption monitoring requires a smart meter baseline, targeted sub-metering of major loads, and a software platform that turns raw data into decisions.
Point | Details |
Monitor before you act | Four weeks of baseline data reveals where savings are actually hiding. |
Focus on the vital few | Tracking 20% of assets that drive 80% of consumption avoids data overload. |
Dynamic tariffs multiply savings | Real-time monitoring is the prerequisite for accessing time-of-use or spot-linked pricing. |
Payback is fast | Mid-sized enterprises recover monitoring investment in 12–18 months on average. |
Standards accelerate results | ISO 50001 turns monitoring data into a structured improvement cycle with measurable KPIs. |
What I have learned from watching energy data in practice
The most common mistake I see is treating monitoring as a one-time installation project rather than an ongoing practice. Teams buy hardware, set up a dashboard, and then check it once a month when the bill arrives. That is not monitoring. That is expensive bill-reading.
The organizations that actually cut costs are the ones that review data weekly, assign ownership, and treat anomalies as urgent signals rather than background noise. A 15-minute interval spike at 2:00 AM in an empty office is not a curiosity. It is money leaving the building for no reason.
I am also skeptical of the idea that more data is always better. The energy monitoring guide principle of focusing on the 20% of assets that drive 80% of consumption is the right instinct. I have seen businesses install sub-meters on every circuit in a building and then spend more time managing the monitoring system than managing their energy use. Start narrow, prove savings, then expand.
The regulatory picture is moving fast. The EU’s push toward 65% smart meter coverage by 2033 will force dynamic tariff access into mainstream use. Homeowners and businesses that build monitoring habits now will be positioned to capture those savings automatically when the infrastructure catches up. The ones who wait will spend the first year just learning what their data means.
— Marc
How Belinus supports your energy management goals
Belinus builds energy management solutions that connect monitoring, storage, and generation into one system. The Belinus EMS runs on 15-minute dynamic tariff optimization, integrates with smart meters, and manages battery arbitrage automatically, so your system responds to price signals without manual intervention.
For homeowners, the Belinus platform connects Solis Inverters, the Energy Wall G1 battery, and EV charging through a single mobile app. For businesses, the same EMS scales to commercial and utility-grade installations, with RESTful API integration for existing building management systems. If you are ready to move from tracking energy to actively managing it, explore Belinus energy solutions and see how the platform fits your setup.
FAQ
What is energy consumption monitoring?
Energy consumption monitoring is the systematic tracking of electricity, gas, or heat use over time to identify waste and reduce costs. It uses smart meters, sub-meters, and software analytics to turn raw usage data into decisions.
How much does a smart meter cost for a home?
Residential smart meter hardware costs approximately €200–220 per unit. Professional monitoring systems for mid-sized businesses typically pay back that investment within 12–18 months.
How do I start monitoring energy usage at home?
Install a smart meter, collect four weeks of baseline data, then identify the two or three appliances or circuits that consume the most power. Use that data to shift flexible loads to off-peak hours.
What is the difference between static and dynamic energy tariffs?
Static tariffs charge a fixed rate per kilowatt-hour regardless of time. Dynamic tariffs adjust hourly based on grid demand, and households with real-time monitoring and load control can save up to 40% compared to flat-rate billing.
Does ISO 50001 apply to homeowners?
ISO 50001 is designed for organizations, not individual households. However, its core principle, defining energy KPIs, monitoring consumption, and running improvement cycles, applies equally well to any homeowner who wants a structured approach to reducing energy costs.
Recommended
Comments