Home Energy Dashboards Explained: Smarter Living in 2026
- Feb 21
- 11 min read
Energy bills in Belgium and the Netherlands can feel unpredictable as prices climb and consumption grows more complex each year. For many homeowners, relying on traditional utility statements means missing out on real-time feedback and actionable insights. A smart home energy dashboard offers immediate access to your household’s electricity, gas, and renewables, showing where every watt goes. By connecting devices across your home, these dashboards deliver real-time data for smarter decisions, helping you reduce waste while supporting sustainability.
Table of Contents
Key Takeaways
Point | Details |
Home Energy Dashboard Benefits | Dashboards provide real-time insights into energy consumption, allowing households to identify inefficiencies and reduce costs by 15-25% in the first year. |
Types of Dashboards | Different types of dashboards (basic, smart home, renewable energy) cater to varying degrees of energy management needs based on household complexity. |
Integration and Automation | The effectiveness of a dashboard increases significantly when integrated with smart devices, enabling coordinated management of energy usage across various systems. |
Financial Considerations | Investing in a home energy dashboard can lead to substantial long-term savings on energy bills, with typical ROI within 3-5 years depending on system complexity and usage patterns. |
What Is a Home Energy Dashboard?
A home energy dashboard is a digital control center for your household’s energy consumption. Think of it as a command center that tracks where your electricity, gas, or renewable energy flows in real-time.
These dashboards translate raw energy data into understandable visualizations. Instead of cryptic meter readings, you see clear graphs showing exactly how much power you’re using right now, this week, or this month.
Why does this matter for Belgian and Dutch households? Energy costs in Central Europe continue rising, and traditional utility bills only tell you consumption after the fact. A dashboard gives you live information to make immediate adjustments.
Smart home energy management systems use advanced technologies to optimize household energy consumption through interconnected devices and real-time monitoring. This means every appliance, solar panel, battery, or EV charger connects to one platform that communicates with each other.
Core Features You’ll Find
Most home energy dashboards include these capabilities:
Real-time consumption tracking showing power usage in watts or kilowatts
Historical data revealing patterns, peak hours, and seasonal trends
Device-level monitoring displaying energy consumed by specific appliances
Cost calculations translating kilowatt-hours into euros spent
Goal-setting functionality helping you target specific reduction targets
Alert systems notifying you of unusual consumption spikes
How It Transforms Your Home
Without a dashboard, you operate blind. You pay your quarterly bill and wonder where the money went. With one, you see immediately when your heat pump cycles on, detect if your refrigerator is running inefficiently, or notice that phantom power drain from devices left plugged in.
Consumers gain detailed insights to manage usage effectively and reduce costs while supporting sustainable energy goals by integrating data streams from various home energy sources. This isn’t theoretical—households using dashboards typically reduce consumption by 15-25% within the first year.
A dashboard transforms energy from an invisible utility into something you can see, understand, and control in real time.
For those with solar panels, batteries, or EV chargers, dashboards become even more powerful. They optimize when you charge, when you draw from storage, and when you export excess power back to the grid.
Pro tip: Start by monitoring your baseline consumption for two weeks before making changes—you’ll identify the biggest energy drains in your home and prioritize what to tackle first.
Types of Home Energy Dashboards and Variations
Not all home energy dashboards work the same way. They vary based on what devices they connect to, how much automation they offer, and what energy sources power your home.
Understanding these differences helps you choose the right system for your specific situation. A basic dashboard differs significantly from an advanced system managing solar panels, batteries, and grid interaction simultaneously.
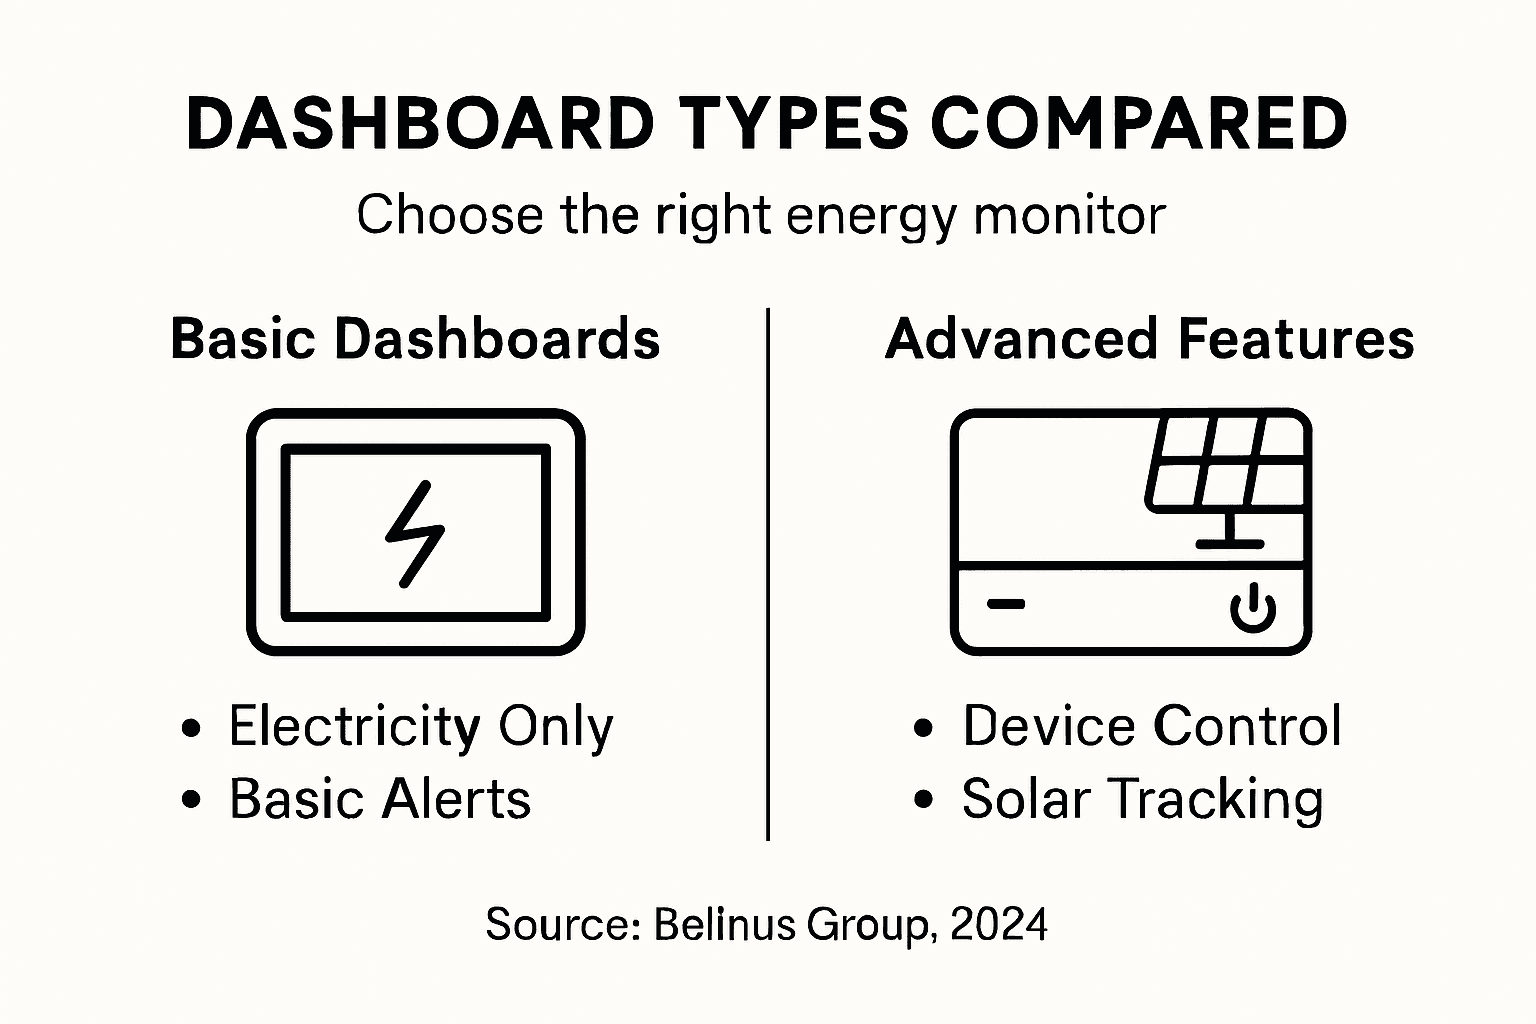
Basic Monitoring Dashboards
The simplest dashboards only track consumption. They receive data from your smart meter and display how much electricity you’ve used.
These systems work well if you want basic awareness without active management. You see your usage patterns, identify peak hours, and understand seasonal trends.
Basic dashboards typically offer:
Real-time kilowatt-hour consumption viewing
Monthly and annual usage comparisons
Cost estimates based on your utility rates
Simple graphs showing consumption patterns
Notifications if usage exceeds targets
Advanced Smart Home Integration Dashboards
These dashboards connect to multiple devices throughout your home. Your heating system, water heater, appliances, and lighting all feed data into one platform.

Advanced systems enable actual control. You adjust your thermostat remotely, schedule appliance usage, or automate lighting based on occupancy. Home energy systems in Europe vary widely in design and functionality, reflecting diversity in energy sources, technology adoption, and user needs.
These capabilities include:
Device-specific energy consumption tracking
Automated scheduling for appliances and heating
Remote control through mobile apps
Energy-saving recommendations based on patterns
Integration with home automation systems
Renewable Energy and Storage Dashboards
If you own solar panels or a battery system, specialized dashboards optimize these assets. They show solar generation in real-time, battery charge levels, and when to use stored energy versus grid power.
These systems become truly intelligent. Energy management models in smart homes differ by their approach to optimization, use of predictive algorithms, and integration with renewable energy and storage solutions.
Renewables-focused dashboards typically manage:
Solar production monitoring and forecasting
Battery charge and discharge optimization
Grid export tracking and revenue calculations
Peak shaving to reduce demand charges
Time-of-use tariff optimization
EV charging integration with renewable timing
Utility-Integrated Dashboards
Some dashboards connect directly to your utility company’s systems. This enables dynamic pricing where you see rates changing throughout the day.
You can adjust consumption when prices drop, essentially playing the energy market. This works particularly well in Belgium and the Netherlands where utilities offer time-varying rates.
The best dashboard type matches your home’s energy complexity and your willingness to actively manage consumption.
Choosing between these types depends on your setup. A rented apartment might need only basic monitoring. A home with solar panels, batteries, and an EV charger requires advanced renewable integration.
Pro tip: Start with a dashboard matching your current setup, but choose one that can expand as you add solar panels or batteries later—avoid systems locked into basic monitoring only.
Here’s how different types of home energy dashboards compare:
Dashboard Type | Device Coverage | Automation Level | Best For |
Basic Monitoring | Smart meters only | No automation | Renters, basic usage tracking |
Smart Home Integration | Heating, appliances | Scheduling and remote | Owners seeking full home control |
Renewable & Storage Optimization | Solar, battery, EV | Predictive, dynamic | Solar/battery/EV owners |
Utility-Integrated | Utility systems | Rate-responsive | Homes on time-variable pricing |
Key Features: Real-Time Insights and Integration
The magic of a home energy dashboard lies in what it shows you and how it connects to your home. Real-time data transforms energy from abstract to concrete.
Instead of waiting for your monthly bill, you see consumption changes instantly. A device turns on somewhere in your home, and the dashboard updates immediately. This visibility changes behavior.
Real-Time Data That Matters
Home energy dashboards provide real-time data on electricity consumption allowing users to identify inefficiencies and make immediate adjustments. You see exactly what’s happening now, not yesterday or last week.
Real-time tracking means:
Current power draw displayed in watts or kilowatts
Instant notifications when consumption spikes unexpectedly
Live cost tracking showing euros spent this hour or day
Identification of which devices consume the most power
Historical comparisons revealing patterns over time
For example, you notice your heat pump cycles on at 6 AM daily. You see your water heater consuming 2.5 kW for 45 minutes. You spot a refrigerator running continuously at higher power than normal, signaling a potential mechanical issue.
Smart Device Integration
A dashboard alone shows only numbers. True power emerges when it integrates with your home’s devices.
Integration with smart meters and IoT devices enables continuous monitoring and control, supporting demand response and renewable energy usage. Your smart thermostat, EV charger, battery system, and solar inverter all feed information to one platform.
This integration enables:
Automated scheduling based on energy prices or solar production
Remote control of heating, cooling, and appliances
Demand response participation for utility rebates
Coordinated charging when renewable energy is abundant
Battery optimization to use stored energy strategically
Customizable Alerts and Notifications
Energy dashboards offer live tracking with alerts for unusual consumption. You set thresholds, and the system notifies you when something changes.
Possible alerts include:
Daily or weekly consumption targets exceeded
Unusual spikes indicating equipment malfunction
Time-of-use rate changes requiring action
Solar production forecasts showing optimal charging windows
Battery discharge warnings
Real-time data plus automation creates the intelligence that reduces energy waste by 15-25% in most homes.
For Belgian and Dutch homeowners, alerts become particularly valuable during peak pricing hours. You can shift consumption away from expensive periods or activate demand response programs for financial rewards.
Pro tip: Set your first alert at 10% above your typical daily consumption—this catches abnormal usage without triggering constantly, helping you catch real problems while avoiding notification fatigue.
Optimizing Solar, Storage, and EV Charging
When you combine solar panels, battery storage, and an electric vehicle, your dashboard becomes a power management command center. These three systems working together create efficiency that none of them achieve alone.
Without coordination, they compete for resources. Your EV charges at midnight when solar production is zero. Your battery drains while excess solar energy goes to the grid. Your dashboard prevents this wasteful scenario.
The Three-System Coordination Problem
Imagine a sunny Tuesday morning. Your solar panels generate 8 kW of power, but you’re away at work consuming only 1 kW. What happens to the remaining 7 kW?
Without optimization, it exports to the grid at low wholesale rates. Your EV sits in a parking lot charging expensively from grid power at 2 PM. Your battery remains at 60% charge. This costs you money and wastes renewable energy.
Proper optimization frameworks integrate solar generation, battery storage, and EV charging to enhance system efficiency. A smart dashboard prevents these misalignments.
How Dashboards Orchestrate These Systems
Your dashboard sees the whole picture simultaneously. It knows:
Current solar production (now 7.2 kW, forecast shows declining clouds)
Battery charge level (65%, can hold 8 more kWh)
EV battery status (parked at home, 40% charged, needs full charge by 5 PM)
Energy pricing (expensive now, cheaper after 8 PM)
Home consumption (1.2 kW baseline, dinner cooking at 6 PM will spike to 3.5 kW)
The dashboard makes intelligent decisions:
Prioritize battery charging with excess solar (free renewable energy)
Hold off EV charging until battery reaches 95%
Shift non-urgent loads (water heating, laundry) to peak solar hours
Reserve battery capacity for evening peak pricing
Charge EV during cheapest grid hours if solar doesn’t suffice
Real Savings From Coordination
Energy storage supports solar power integration and EV charging management, reducing grid stress while enabling higher clean energy penetration. This coordination creates tangible financial benefits.
Optimized homes typically achieve:
30-40% reduction in grid electricity purchases
40-50% increase in renewable energy self-consumption
15-25% total energy cost reduction
Faster EV charging during solar abundance
Better battery lifespan (strategic charging patterns)
The Dashboard Intelligence Required
Simple dashboards cannot manage this complexity. You need systems that integrate solar energy consumption optimization with real-time pricing and weather forecasting.
Advanced capabilities include:
Weather forecasting to predict solar generation 24-48 hours ahead
Demand forecasting based on calendar and historical patterns
Dynamic pricing integration from your utility
EV charging schedules aligned with solar windows
Battery cycling optimization for longevity
Grid export timing during profitable periods
When all three systems communicate through one dashboard, your home becomes a mini power plant that maximizes self-consumption while earning from grid services.
For Dutch and Belgian homeowners, this matters significantly. Time-of-use pricing varies hourly, solar potential fluctuates seasonally, and grid demand charges penalize peak consumption.
Pro tip: Schedule your EV charging for 11 AM to 1 PM and 2 PM to 3 PM when solar typically peaks—this single change saves 200-300 euros annually while reducing grid load.
Financial Benefits, Common Pitfalls, and Alternatives
A home energy dashboard costs money upfront but saves money over time. Understanding both sides of this equation helps you make an informed decision.
The financial case is compelling for most Belgian and Dutch homeowners. Energy costs continue rising, and your consumption patterns waste thousands annually if left unmanaged.
Real Financial Benefits
Investments in energy efficiency, including home energy management systems and dashboards, contribute to significant cost reductions in household energy bills. These savings come from multiple sources.
Typical financial gains include:
15-25% reduction in annual electricity consumption
200-400 euros saved annually on energy bills (depending on system complexity)
ROI achieved within 3-5 years for most installations
Increased home resale value (typically 1-3% premium)
Qualification for government subsidies and tax deductions
Protection against future price increases
For example, a household spending 1,200 euros annually on electricity could save 240 euros in year one. A mid-range dashboard system costs 800-1,200 euros, paying for itself within 4-5 years.
Below are typical financial outcomes and risks when using home energy dashboards:
Outcome | Average Value | Key Risk | How to Maximize Benefit |
Annual Savings | €200-400 | High upfront cost | Choose scalable systems |
Payback Period | 3-5 years | Overestimating savings | Confirm realistic savings |
Home Resale Premium | 1-3% increase | Neglecting maintenance | Maintain and update software |
Government Incentives | Subsidies, tax breaks | Incompatible installation | Research local programs |
Common Pitfalls to Avoid
Smart energy management tools help consumers optimize consumption and reduce expenses, though common pitfalls include installation costs, user engagement issues, and integration challenges with existing home systems.
Here’s what goes wrong:
Purchasing a system without understanding your home’s energy profile first
Neglecting to set up alerts and monitoring routines (passive dashboard wastes money)
Choosing incompatible systems that don’t work with your existing devices
Ignoring installation and integration costs in your budget calculations
Expecting immediate savings without behavioral changes
Failing to maintain or update the system after installation
Many homeowners buy dashboards assuming the technology alone creates savings. It doesn’t. The dashboard shows you problems; you must act on that information.
Alternatives Worth Considering
Dashboards aren’t your only option. Complementary or alternative approaches include:
Behavioral audits: Professional energy consultants identify inefficiencies for 300-500 euros (one-time cost)
Smart thermostats alone: Can save 100-150 euros annually without full dashboard integration
Community energy programs: Share renewable infrastructure costs with neighbors
Utility demand response programs: Earn credits for shifting consumption during peak hours
Simple meter monitoring: Free or low-cost apps that track usage without automation
The best strategy often combines approaches. A behavioral audit reveals your biggest energy drains, then a dashboard automates the solutions you’ve identified.
The dashboard’s real value emerges when it changes your behavior, not from the technology itself.
For renters or those uncertain about long-term residency, simpler solutions like smart thermostats provide meaningful savings without major installations.
Pro tip: Calculate your payback period before purchasing: divide total system cost by annual savings. If it exceeds 7 years, explore simpler alternatives first or wait for better technology pricing.
Take Control of Your Home Energy with Belinus Solutions
Understanding and managing your home energy consumption is no longer a challenge only for experts. With rising energy costs in Belgium and The Netherlands, the article highlights how real-time insights, smart integration of solar panels, battery storage, and EV charging, combined with an intelligent energy dashboard, empower you to reduce waste and save money. If you want to overcome the common pitfalls of unmanaged energy use and complex systems, you need a comprehensive, scalable solution that grows with your home’s needs.

Unlock the full potential of your home energy setup with Belinus. Our group offers cutting-edge products like the Energy Wall G1 graphene supercapacitor, Solis inverters, and the ETAP Pro EV Charger. All integrate seamlessly into the centralized Belinus Energy Management System that provides dynamic tariff optimization, real-time battery arbitrage, and multi-technology support. Visit Belinus today to discover how our solutions ensure your home operates as an intelligent mini power plant. Start saving up to 25% on your energy bills and future-proof your energy independence now.
Frequently Asked Questions
What is a home energy dashboard?
A home energy dashboard is a digital platform that tracks and displays a household’s energy consumption in real-time, providing insights into electricity, gas, and renewable energy usage.
How can a home energy dashboard help reduce energy costs?
By providing real-time data and detailed insights into energy consumption, a dashboard allows homeowners to identify inefficiencies and adjust usage patterns, potentially leading to a 15-25% reduction in energy costs within the first year.
What are the different types of home energy dashboards?
Home energy dashboards can be categorized into basic monitoring dashboards, advanced smart home integration dashboards, renewable energy and storage dashboards, and utility-integrated dashboards, each offering varying levels of connectivity and automation.
How do home energy dashboards optimize the use of solar panels and batteries?
These dashboards monitor solar production and battery charge levels, allowing for intelligent management of energy consumption, such as using solar power during peak generation times and optimizing EV charging to maximize savings.
Recommended
Comments